
Collahuasi mine, is porphyry Copper (Cu) – Molybdenum (Mo) deposit, located North of Chile near the end of major fault, Domeyko fault which trends North-South. The geology stratigraphy types include rock in the upper Paleozoic to lower Triassic Collahuasi group, the Jurassic Quehuita Formation, the upper Cretaceous Cerro Empexa Formation and the granitoid plutons of Paleocene to Eocene age, the Ordovician basement rock where intruded by granite age to 431±10 Ma (figure 4.2.1.1; Fonkwe et al., 2012).
The Rosario mineral deposit which is one of the Collahuasi flagship is Cu-Mo deposit of approximately 2.2 billion tonnes with average grade of 0.82% Cu. Other close by deposits include Ujina, Quebrada Blaca, Chuquicamata and Escondida shown in (Figure 4.2.1.2; Alruiz et al., 2009).
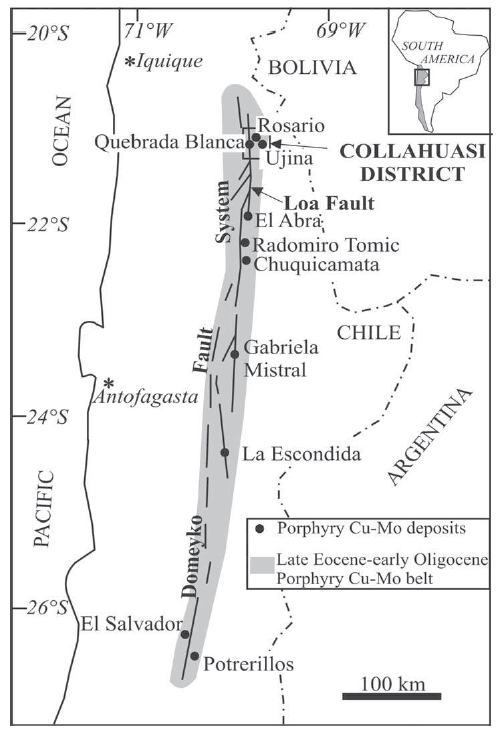
Figure 4.2.1.1: Location map showing the major porphyry Cu-Mo deposits of the Collahuasi district and other porphyry Cu-Mo deposits of the upper Eocene lower Oligocene porphyry Cu-Mo belt of northern Chile. Late Eocene – early Oligocene porphyry Cu-Mo deposits are spatially associated with the Domeyko fault system. The Loa Fault is also shown (Fonkwe et al., 2012 and reference therein)
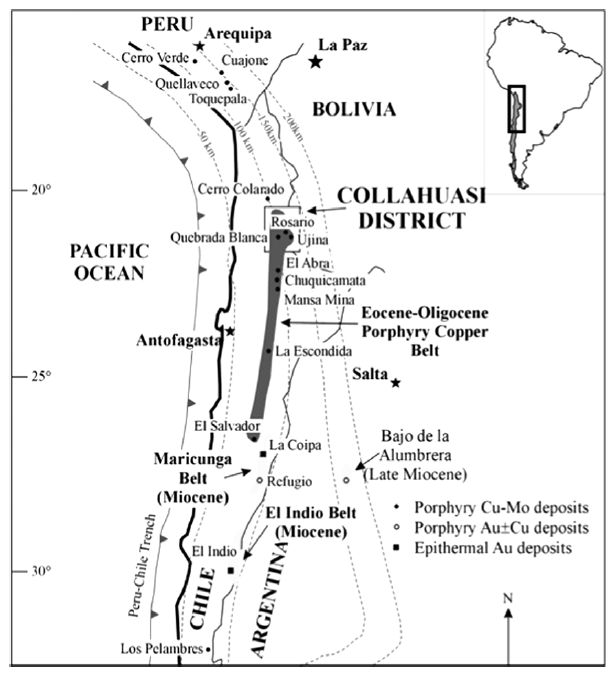
Figure 4.2.1.2: Rosario mineral deposit and metallogenic strips in the North of Chile (Alruiz et al., 2009).
Geometallurgical program was established and divided in to two stages. The first stage was to group the geometallurgical domain based on geological similarity and second stage was to plan sampling phase on basis of predetermined domain for the next 5 years (2008-2012). Total of six domains were identified and labelled as UGM1-6 as shown in the table 4.2.1.1. Drilling was commission for the purpose of the study and they include 1500 m PQ size core, 1500m HQ size. The drill core was detailed logged for 2m increment for lithology, structure, alteration, mineralization and geotechnical work was also completed. The drill core was then selected for samples deemed representative of the ore type and sent for comminution testing by the geologist. The samples are proportioned to represent the mass of the available ore. Comminution test measures the breakage, breakage distribution and grinding. JKtech drop weight was used for breakage and breakage distribution and bond ball work index was used to measure grindability of the ore (Alruiz et al., 2009). The breakage test is an assessment made to striking of the sample, except when used rotary breakage which uses blade. The reliability of each of the drop weight test is summarized in table 4.2.1.2.
Table 4.2.1.1: Rosario mineral deposit, representative sampling campaign within the period 2008 – 2012 (Alruiz et al., 2009).
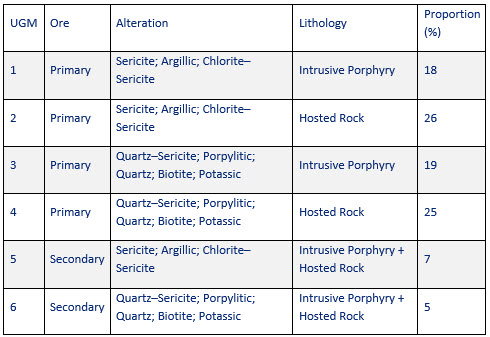
Table 4.2.1.2: The reliability of the drop relative with other measurement test for competency. (Mwanga, 2016).
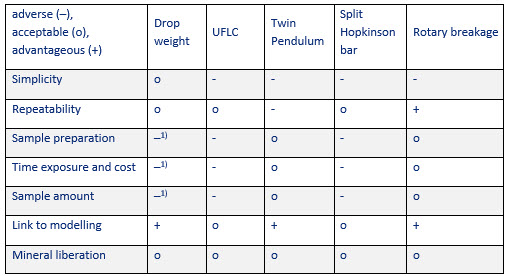
JK drop weight test –1)
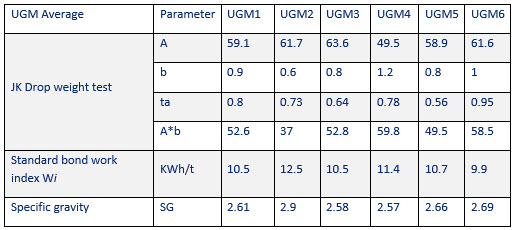
The comminution test result is summarized in table 4.2.1.3. The six domains sampled, domain 2 (UGM2) which make up 26 percent of the total ore has the highest hardness value, while domain 4 (UGM4) and 5 (UGM4) show some variability of JK drop test.
Table 4.2.1.3: JK Drop-weight and Bond ball work index test results on composite samples. (Alruiz et al., 2009)
The JK drop weight was used to simulate the semi autogenous mill (SAG) and bond work index (BWi) for bond mill circuit, using JKSim met software. Feeds were simulated in the SAG mill circuit in which the throughput incrementally varied and transfer size (product transfer to bond mill) recorded. During the simulation, the variables that will impact the SAG were kept at constant i.e. ball load, speed and % solids. Collahuasi operation is ball mill capacity limited so SAG was tested for wider energy consumption for different size. Blast design was incorporated in the simulation for different feed size and the results were recorded. The procedure where carried out using A*b data for each domain (UGM) and the associated throughput and transfer size was input in the bottom equations 1 and 2 to calculate bond mill circuit final grind. Grinding values J and K depends on metallurgical unit as summarized in table 4.2.2.2, grinding of line 1-2 and 3. Simulation data gathered were iterative process, figure 4.2.2.1A. It important to note that as P80 increase the SAG power consumption decrease as a function of the transfer size product figure 4.2.2.1B. Specific mill power consumption (S.P.C) is determine using simple power equation 3.
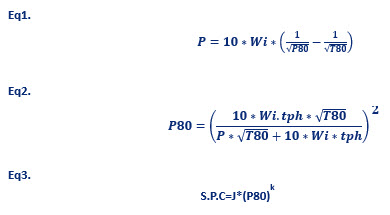
P= Ball mill circuit power draw
Wi= Bond laboratory work index (kWh/t)
tph= SAG circuit throughput
P80= Ball mill circuit final grind
![]() = SGA throughput and transfer size in tph (metric tonnes per hour)
= SGA throughput and transfer size in tph (metric tonnes per hour)
Table 4.2.2.1: Grinding line 3 and 1-2. The J and K calculated values determine the specific energy calculated and it is used in equation 3, modified from Alruiz et al. (2009).
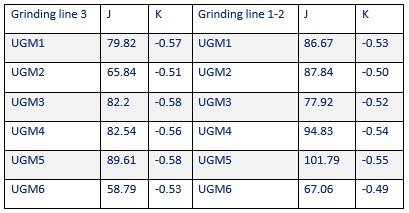
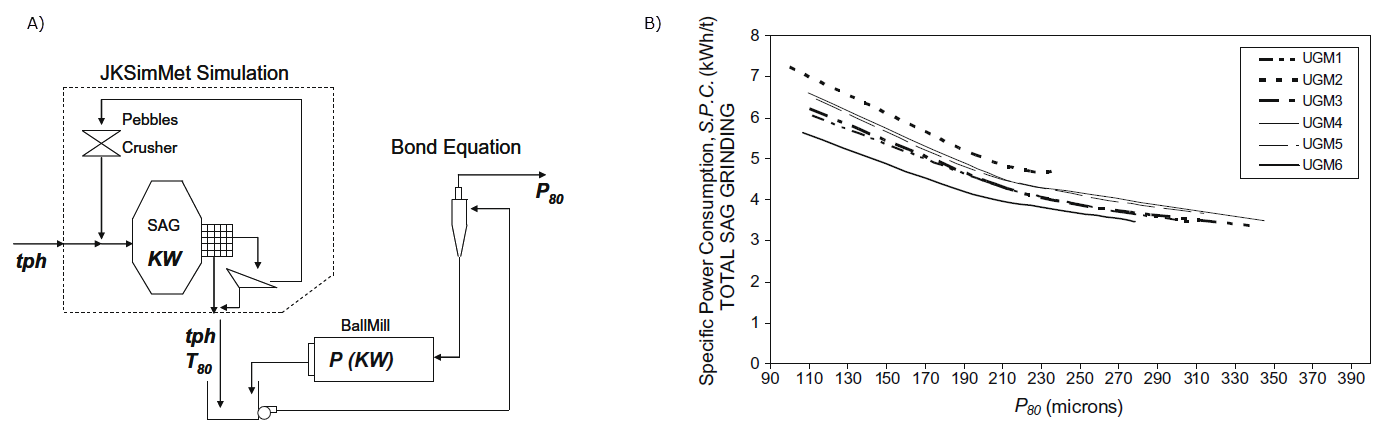
Figure 4.2.2.1: Simulation process: (A) Milling procedure followed for each domain (UGM); (B) shows the SGA mill energy consumption with respect to feed size (Alruiz et al., 2009).
The S.P.C vs. P80 relationship, calculated from earlier equations was then used to predict the throughput. Equipment maintenance shutdown is also factored in the model to reflect reality at the mill. Model was validated against true block value to determine if there was any conditional bias in the data and the two data were closely matched after 5 years of production figure 4.2.3.1 and 4.2.3.2.
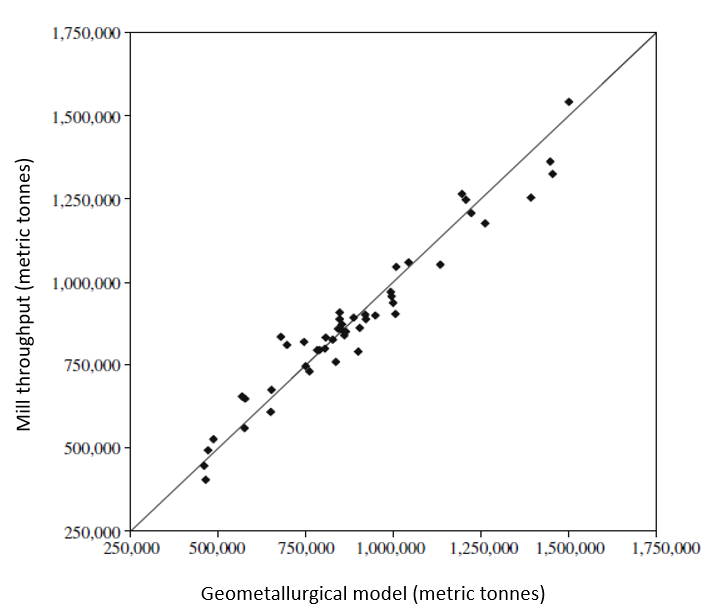
Figure 4.2.3.1: Model validation by comparing true throughput against the geometallurgy model (Alruiz et al., 2009).
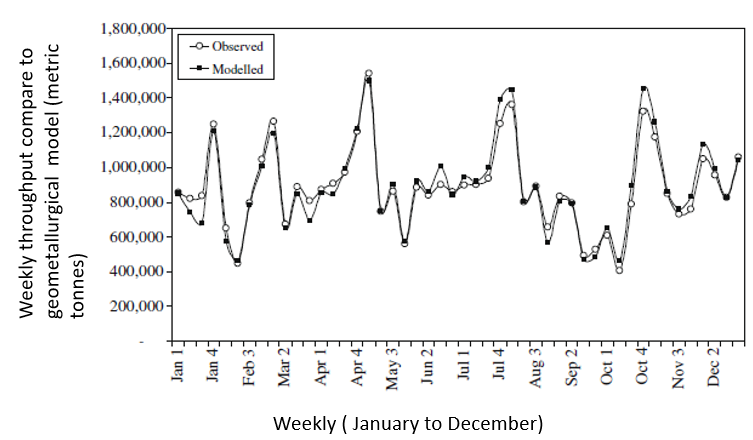
Figure 4.2.3.2: Weekly throughout compared to the geometallurgical model for one full year (Alruiz et al., 2009).
Alruiz, O.M., Morrell, S., Suazo, C.J., Naranjo, A., 2009, A novel approach to the geometallurgical modelling of the Collahuasi grinding circuit: Minerals Engineering, v. 22, p. 1060-1067.
Djouka-Fonkwe, M., Kyser, T.K., Clark, A.H., Oates, C.J., Ihlenfeld, C., 2012, Recognizing Propylitic Alteration Associated with Porphyry Cu-Mo Deposits in Lower Greenschist Facies Metamorphic Terrain of the Collahuasi District, Northern Chile—Implications of Petrographic and Carbon Isotope Relationships: Economic geology, v.107, p. 1457-1478.
Mwanga, A., Rosenkranz, J., and Lamberg, P., 2015, Testing of ore comminution behavior in the geometallurgical context – a review: Minerals, v. 5, p. 276-297.